
Businesses frequently are faced with complex decisions and utilizing the right tools to can improve the confidence in the results. This article introduces the concept of Discrete Event Simulation as an effective alternative to spreadsheet analysis.
Real Life Variability
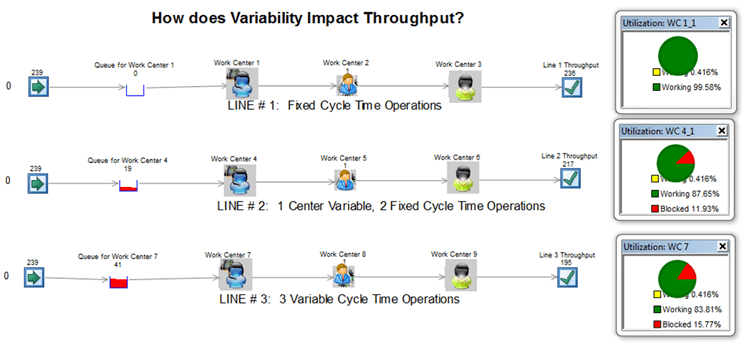
Most processes contain more variability than the user realizes. For a bank processing a loan application, it is obvious that if it takes 10 minutes to review a single applicant’s credit information, it could take 3 times as long if there are three applicants. However, the type of loan, the underlying assets and business entity structure could add additional levels of complexity and time to process the loan. In a manufacturing setting, even on a machine that has a fixed cycle time, the time to load and unload parts, random equipment breakdowns, raw material quality and employee skill level can impact the overall production time.
Spreadsheets are a great tool for static analysis but cannot address situations where parameters, such as resource levels, processing times, and queue size are changing over time. Utilizing average or mean data can lead to inaccurate results in critical metrics like throughput, resource utilization or customer waiting time. Simulation models offer the flexibility to describe and model the steps, the discrete events in a process, as they actually occur in real life.
Visual Engagement
Analysts can easily create charts and graphs or tables to present the results from their spreadsheet; however, it may be difficult to communicate the detail of the assumptions or formulas used in the analysis. On the other hand, an animated simulation allows the analyst to share a visual representation of items actually flowing thru the process so it can be validated by process experts and quickly understood by managers. Real-time results can be displayed as the model runs so potential inaccuracies in the model and true problems come to life.
Animation becomes an even greater benefit as changes to a process are made. Whether the team steps through the animation slowly to better understand the new process details or, in minutes, runs a year’s worth of simulated production, their buy-in to the changes will increase.
Summary
Simulation modeling enables the Process Improvement Analyst to quickly explore the parameters of a process, understand how they impact key metrics, and then incorporate the level of detail necessary to generate an accurate result. While spreadsheets are still the best tool for analyzing static processes or situations with few interdependencies or constraints, Discrete Event Simulation modeling captures the variability and randomness of the world and communicates the results in a powerful format.